TECHNICAL TOOLS FOR DAY TRADERS (PART1)
A wide array of technical approaches is available. Some are better suited to particular personalities and styles of trading than others. This article will focus on just a few that I have found to be consistently helpful in interpreting intraday market behavior and making short-term price forecasts.
My trading timeframe of choice is the intraday, primarily because it affords the greatest degree of immediate feedback. An important element for consistent success is the ability to quickly realize one's mistakes. Intraday trading offers us a way to "have our finger on the button", and ready to take quick evasive action should our market judgements prove incorrect. Technical analysis tells us what has happened on a fairly consistent basis in the past, but it makes absolutely no guarantees about the future.
Oscillator Divergence/Momentum Confirmation
The nature of day trading requires that the futures trader make a constant assessment as to whether a market is in a trending or trading-range mode. If the mode is determined to be trading-range we need a convenient means of identifying short term reversal points. On the other hand, if the mode is assumed to be trending, we require a means of identifying (1) an appropriate entry point based on the trend currently in force, and (2) an appropriate exit point based on likely trend exhaustion.
An effective means of identifying such short term intraday market turning points involves an evaluation of the momentum behind successive market swings. Price momentum is the measure of the rate, or speed, of price change. Normally, if we are to expect successive market swings to continue creating new highs or new lows, we would expect the rate of price change to increase along with the move to new highs or new lows. If successive swings do not have an increase in momentum, the validity of any new push higher or lower is called into question.
One very effective tool for measuring price momentum is the 3/10 Oscillator. It is a simple indicator constructed by subtracting the 10 period Exponential Moving Average from the 3 period Exponential Moving. As an alternative, most charting packages offer construction of the MACD indicator (Moving Average Convergence-Divergence). The 3/10 Oscillator can be simulated with the MACD by setting the short term parameter to 3, the long term parameter to 10, and the smoothing parameter to 1.
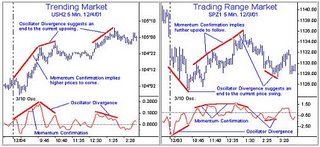
When using the 3/10 Oscillator, we are attempting to identify one of two conditions on successive market swings that move to either new highs or to new lows. The first of these conditions is referred to as "Oscillator Divergence" and the second as "Momentum Confirmation". The two terms describe opposite conditions. Typically, each successively greater swing pivot high or swing pivot low will be accompanied by one or the other.In a market trending towards lower prices, Oscillator Divergence is described as a swing to new lows in price which is accompanied by a higher low in the oscillator. In a market moving towards higher prices, it is described as a swing to new highs in price which is accompanied by a lower high in the oscillator. Examples of both conditions are presented in the charts below.
In essence, Oscillator Divergence indicates that the current market movement is losing momentum. It is at these times that a reversal is most likely. If we had been considering a trade in the direction of the expected reversal, this would be an opportune time to initiate entry. On the other hand, when Momentum Confirmation occurs, we know that the current swing direction has some "oomph" left to it, and it would be best to either stay with existing positions or look for an opportunity to climb on board.
When properly used, the 3/10 Oscillator can become a very helpful tool for the day trader. It is a quick and effective means of measuring market momentum, revealing valuable information about the market's underlying intent. Become proficient in its use, but also realize that it is not infallible.
-------------------------------------------NEXT
![]()