TECHNICAL TOOLS FOR DAY TRADER (PART2)
Judgements made about likely market behavior which are based on momentum analysis can be even more productive if we have predetermined levels available which can act as "price templates" in interpreting the day's trading activity. The "Pivot System" is one such approach.
Floor traders and other professionals who do the actual buying and selling of futures contracts in the trading pits of the exchanges, generally employ very similar systems for valuing the price of these instruments in the absence of significant outside influences. This Pivot System of Support and Resistance determines relative valuation levels based on price activity of the prior day.
Pivot System price levels act as potential support and resistance zones throughout the day. They serve as focal points for floor professionals as they adjust their bids and offers, especially when trading activity is slow. The off-floor day trader is able to use these same values as an aid in determining appropriate areas for trade entry, stop placement, and exits.
The formulas for calculating Pivot System Support and Resistance Levels are as follows:
DP = (H + L + C) / 3
R1 = 2 * DP - L
S1 = 2 * DP - H
R2 = DP + (R1 - S1)
S2 = DP - (R1 - S1)
DP represents the Daily Pivot. R1 and R2 identify the resistance levels above the Daily Pivot. S1 and S2 identify the support levels beneath the Daily Pivot.
The principle level of reference is the Daily Pivot. Generally, as we enter each trading day, we regard this level as our balance point between bullish and bearish forces. A demonstration of significant price activity above the Daily Pivot is considered to have bullish implications, while activity below is bearish. Although actual trade entry and exits are initiated by a variety of other market factors, we first look at price behavior relative to the Daily Pivot level as an aid in determining the market's general directional bias.
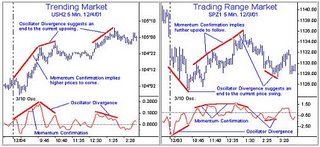
The day's trading activity can generally be thought of as revolving around and gravitating towards the Daily Pivot level. As price moves away from this zone and approaches either the first level of resistance (R1) or the first level of support (S1), market behavior becomes increasingly important. Any rejection of these newly attained levels increases the likelihood of a return to the Daily Pivot. On the other hand, a breach of either of these initial levels is regarded as market acceptance and a perceived change in the valuation of the instrument being traded.
Additionally, should the market extend its move even further from the Daily Pivot, penetration through each successive level of support or resistance is generally regarded as having drawn in a greater degree of participation from off-floor interests. An increase in off-floor interests represents a greater likelihood that longer-term positions are being established, resulting in greater potential for the market to trend even further. Each consecutively greater level of Pivot System support or resistance breached is generally regarded as having stirred the interest of successively longer term participants.
Once the market has made a convincing breach of a particular support or resistance level, that level is considered to have reversed its support/resistance role, and, subsequently, becomes a test point for further market activity. For example, in the chart to the right, when price action develops into an upside break of the first level of resistance (R1), the retracement move back towards that level is considered a test of its integrity. A successful test occurs when the retracement move is turned away and price moves even further to the upside - which adds even greater credibility to that level as a renewed valuation point. Additionally, any further move away from that level has the potential to force the market through successive levels of support or resistance, drawing players of even longer time-frame perspectives into the market . . . and so on, continually expanding the market's range of activity.
When properly used, Pivot System Support and Resistance Levels can become a very helpful tool for the day trader. The approach is not only a quick way of gauging intraday valuation levels, but also offers an effective means of applying interpretative "templates" to market activity so as to better understand market behavior and spot opportunity. They help to determine when and where short-term intraday trends are likely to hesitate, and can also serve as "test points" in deciding whether the market may be more likely to either continue or reverse its current direction.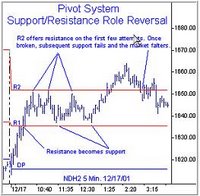
![]()