TECHNICAL TOOLS FOR DAY TRADERS (PART3)
As helpful as Pivot System levels often are, a significant drawback to their use lies in the fact that they are calculated from the prior day's price action, and may not accurately reflect recent changes in market psychology. Effective intraday trading also requires a means of identifying support and resistance which can more easily adapt and more accurately represent price activity under rapidly changing market conditions. The 20 period Exponential Moving Average (20EMA) can be used to create these more "dynamic" levels of support and resistance. Unlike Pivot System S&R levels that remain constant throughout the day, the 20EMA changes in accordance with more immediate changes in price. This feature makes them a very effective tool, especially when significant shifts in market psychology occur between Pivot System levels, and after large thrusting impulse moves.
My principle intraday chart reference is the five minute timeframe with frequent note of other periods as market conditions warrant. For this reason, the 5 min. 20EMA is our most often referenced moving average. However, it is also helpful to additionally graph both the 15 min. and 30 min. 20EMAs on the same 5 minute chart. This is accomplished by plotting the following values.
5 min. 20EMA - plot a 20 period Exponential Moving Average.
15 min. 20EMA - plot a 60 period Exponential Moving Average (15/5*20)
30 min. 20EMA - plot a 120 period Exponential Moving Average (30/5*20)
It is important to recognize that the 15 and 30 minute values arrived at with this method are not exact and precise representation of the corresponding 15 and 30 minute 20EMAs, but for purposes of identifying potential support and resistance levels, you will find the technique quite useful.
The 20 period EMA is treated as we would any other potential support or resistance level. In congested, trading range market conditions, these levels can be violated rather easily. However, when price begins to trend, the 20EMA can be a valuable aid in determining appropriate areas in which to take action either by establishing new positions . . . or baling out of existing ones.
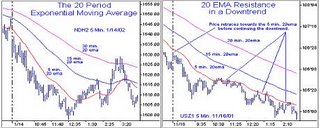
One of the more frequent uses of this indicator comes into play when we began a particular trading day expecting the trend established in the previous day to continue. A common strategy on such days is to look for an opportunity to enter on the first retracement move which takes price back towards a likely support (if in an uptrend) or resistance (if in a downtrend). The first level of support or resistance encountered is likely to be that of either the 5 minute 20EMA, the 15 minute 20EMA, or the 30 minute 20EMA (chart above right). It is important to keep an eye on these levels when we are expecting trend continuation. Once a trend has been established, it is very often the case that one of these levels (most often the 5 min. 20EMA) will contain the price action quite effectively.
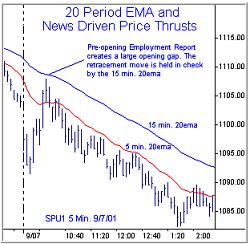
The 20 period EMA can also come into play immediately following large news-driven price thrusts (chart at right). Trading conditions can often be so volatile during such periods that I generally discourage any sort of participation until the initial hysteria subsides. Typically, the strong impulse thrust that accompanies such events are the beginning statement in a new trend move. Such price behavior will usually undergo some sort of retracement activity before an advance of significance takes hold. Again, the 20 period EMA is an excellent tool for gauging the degree of retracement and likely return to the trend.
As stated earlier, the "dynamic" characteristics of the 20 period EMA is what makes the indicator such an important tool. It's ability to react in accordance to more immediate changes in the market environment make it a valuable aid in creating structure out of essentially unstructured events.
Use of Prior Day Highs and Lows
Each of the intraday trading techniques discussed so far have relied on reference levels arrived at by means of mathematical calculations. The technique discussed in this section, in contrast, will deal with a set of support and resistance levels which are much more intuitively obvious. In short, we will discuss a technique for using the prior day's price extremes as a means of determining market-based valuation levels.
If market activity is thought of as an auction process, where bidders and sellers are constantly vying for the most advantageous price, daily timeframe highs and lows represent the outer extremes of accepted value for any particular trading day. The highest price achieved during the day represents the maximum that buyers were willing to offer for the commodity, and the lowest price represents the minimum that sellers were willing to accept. For this reason, subsequent price action has a tendency to remain within the boundaries of apparent value as defined during the previous day of trading.
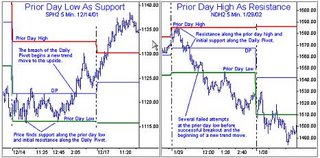
Under typical market conditions (news-driven price thrusts being one notable exception) a successful breach of a prior day high or low is normally preceded by several failed attempts. Once achieved, such price action often represents an important shift in market psychology with the potential to create a new trend move.
One approach for taking advantage of this market scenario is to use the actual break of the prior day high or the prior day low as the trigger into the trade - going long on a break of the high, and short on the break of the low. Using such a method for market entry is certainly viable, and, in fast market conditions may be the ONLY way of participating. However, it is considered to be a rather aggressive technique, for forays into new areas of market valuation are sometimes rejected in very quick fashion. A more conservative and risk averse approach is to delay entry until some sort of price retracement can occur. Such short-term pullbacks often take place before a new trend move can begin in earnest. Many times, a breach of the prior day high or low will retrace all the way back to the original breakout point. If not, the next most likely level of retracement will be that of the 5 min. 20EMA.
Price analysis relative to prior day highs and lows can also prove helpful when markets get caught in extended, tight-range trading conditions. This kind of market scenario is often followed by extreme range expansion and a pickup in volatility. Sometimes the increase in volatility can be very sudden and dramatic, leading to trading days well-suited for capturing large profits - but only if you've chosen the correct breakout direction.
Whenever low volatility conditions have been identified, a break of a prior day high or low can often serve as the cue that the expected range expansion move has begun and can put us on watch for reduced-risk ways to participate. But even before such a break occurs, there are a few techniques that offer an advanced assessment of likely breakout direction and allow for earlier entry. For example, we can often determine directional clues from price action relative to the prior day high, prior day low, and the current Daily Pivot. If the market first approaches the prior day low, and is then repelled upwards through the Daily Pivot, breakout direction is likely to be towards higher prices (below left chart). Similarly, if the prior day high is approached, repelled, and price then moves through the Daily Pivot from above, likely breakout direction is to the downside (below right chart). Furthermore, often directional clues can also be found in market behavior near the Daily Pivot. If price activity is unable to breach this level, the expected breakout will often develop on a path opposite that of the original approach.
Prior day highs and prior day lows represent extreme points of apparent value. As such, they contain the potential to act as support and resistance levels throughout the trading day. Price behavior near these levels can offer valuable clues as to the market's underlying intent.
Conclusion
Typically, most new traders approach the study of technical analysis with an eye towards identifying a single indicator, system, or trading methodology which, when practiced with precision and discipline, will reap rewards on each and every trade attempt (or at least very nearly so). Many traders, especially beginners, in their unending search for this one and only ultimate trading tool, tend to look at this discipline as having such potential . . . as containing the possibility of being the long sought-after magic key which unlocks the hidden secrets of future market direction. It is important that we not regard ANY technical trading tool in this light. Instead, they are better regarded merely as an aid in summarizing and simplifying certain discretionary aspects of our trading routine. Technical analysis gives an indication of what has happened on a fairly consistent basis in the past, but it make no guarantees of the future.
The techniques discussed in this article will jumpstart your understanding and interpretation of price behavior and underlying market intent, but don't expect them to become your Holy Grail. It is very likely that it may take a great deal of practice before you can comfortably integrate them into your normal trading routine. Some will be more effective under certain market conditions than others. Plan on spending considerable time with each tool before you start to fully realize its benefits as well as its shortcomings. As with all effective trading tools and techniques, nuance and idiosyncrasy become more apparent with practice.
![]()